Decades of development in data and computer science are catapulting AI capabilities to new heights.
Natural language processing (NLP) enables generative chatbots like ChatGPT and Google Gemini to engage users in conversational interactions. Machine learning (ML) algorithms leverage big data to predict patterns and accurately complete tasks.
This article will focus on a key subset of AI: machine learning algorithms (ML algorithms). An ML algorithm is a computational set of instructional processes. They empower AI systems to learn, detect patterns, and predict outputs from data.
Innovations in ML algorithms are finding their place industry-wide. Cybersecurity systems are being augmented with ML to anticipate cyber threats, and in healthcare, it’s being used for early disease detection.
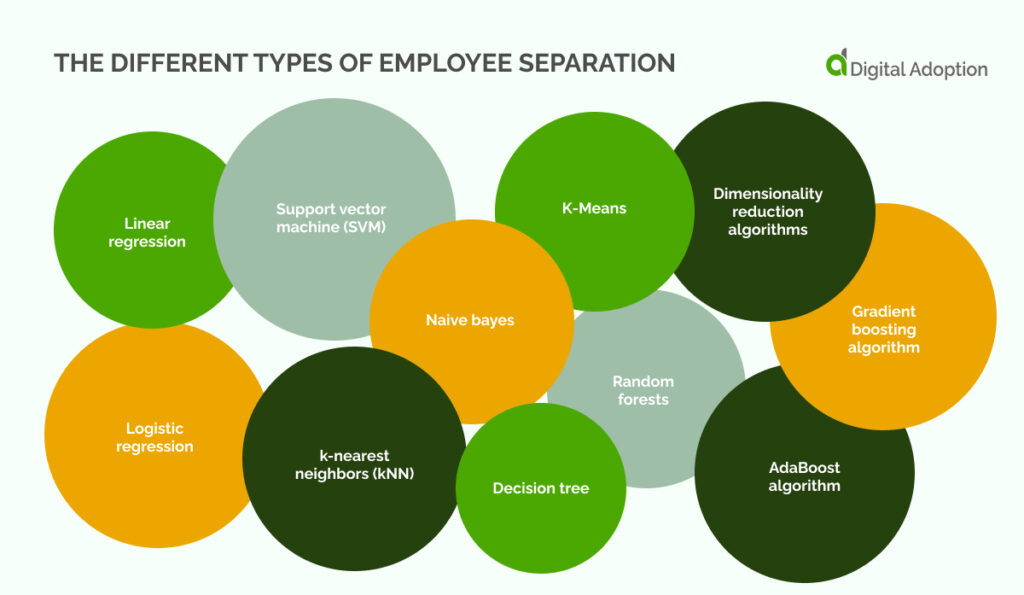
Sophisticated AI systems have graduated from the pages of science fiction and firmly entered the real world. This article delves into eleven machine-learning algorithms set to innovate almost every major industry.
Let’s get stuck in.

- Linear regression
Supervised ML algorithms follow two main functionality lines to help solve specific problems: classification and regression.
Linear regression is a form of supervised ML wherein algorithms learn from input data to predict continuous outcomes. This method aims to understand how one or more independent variables influence the target output.
It teaches algorithms to predict outputs and identify patterns based on the data it’s fed. The independent variables can be one (simple linear regression) or multiple (multiple linear regression).
Beyond its core functionality, linear regression offers several advantages. It’s a relatively simple algorithm to understand and implement, making it a great starting point for beginners in machine learning.
Linear regression also excels at tasks where the relationship between variables is linear. In these scenarios, it provides accurate predictions and interpretable results. However, it’s important to remember that linear regression assumes a linear relationship between the independent and dependent variables. The model’s accuracy may suffer if the underlying relationship is more complex.
Techniques exist to address non-linear relationships, but they can add complexity to the model. Linear regression is a pillar of supervised learning. This is due to its interpretability, ease of use, and effectiveness in predicting continuous outcomes.
- Logistic regression
Logistic regression predicts categorical outcomes. It transforms linear regression, employing a logistic function to handle binary classification problems.
Data analytics officers use this algorithm for tasks such as spam detection and credit scoring. This is mostly because of its simplicity and efficiency. Logistic regression operates on the assumption that the predictors are related to the log odds of the dependent variable. This model is interpretable, providing insights into the relationships between variables.
However, logistic regression is limited to binary classification problems. Multinomial logistic regression offers a solution for situations with more than two categories. It’s also important to consider logistic regression assumptions. These include linearity and independence of errors.
Logistic regression is essential in many machine learning toolkits due to its interpretability and ease of use. It’s a stepping stone to more complex algorithms and clearly explains the relationships between features and the target variable.
- Decision tree
A decision tree is a predictive model that maps observations about an item to conclusions about its target value. It segments the data into subsets based on feature values. This creates a tree structure where nodes represent features and branches represent decision rules.
Decision trees handle both categorical and continuous data. This makes them versatile tools for various applications. Their interpretability is a major benefit. Following the branches of the tree, we can understand the reasoning behind the prediction. This transparency is valuable in finance, where risk analysis requires clear decision justification.
Decision trees excel at handling complex datasets with a mix of data types. In healthcare, for example, they can be used for patient diagnosis. Factors like symptoms, medical history, and test results are considered. However, decision trees can be susceptible to overfitting. Sometimes, they are too specific to the training data and perform poorly on unseen examples.
Pruning techniques can help mitigate this issue. Decision trees may not always capture the most nuanced relationships within the data. However, decision trees are still widely used in machine learning due to their interpretability and ability to handle diverse data types.
- Support vector machine (SVM)
Support Vector Machine (SVM) is a powerful classifier designed to find the hyperplane that best divides a dataset into classes. It performs well in high-dimensional spaces and is effective for problems where the number of dimensions exceeds the number of samples. SVMs are used in image recognition and bioinformatics. They support kernel functions, enabling them to perform a non-linear classification efficiently.
Despite their strengths, SVMs have some limitations. They can be computationally expensive to train for very large datasets. Kernel functions allow for non-linear classification. However, choosing the optimal kernel and its parameters can be challenging.
Ongoing research continues to address these issues. SVMs are still a powerful choice for many classification tasks. This is because they handle high-dimensional data and find the best separation line between categories.
- Naive bayes
Naive Bayes leverages Bayes’ theorem. It does this with the ‘naive’ assumption of conditional independence between each pair of features. This simplicity makes it highly scalable for large datasets and suitable for real-time prediction.
Due to its robustness to irrelevant features, it is extensively used in text classification. This includes spam filtering and sentiment analysis. Despite its simplicity, it outperforms more complex models in specific domains.
However, the “naive” assumption of independence can lead to underperformance when features are truly interdependent. Naive Bayes can be sensitive to the presence of noise in the data.
Naive Bayes remains a popular choice for many tasks. It’s efficient, interpretable, and performs strongly in text classification. It is a robust baseline model and can be a valuable tool in exploring more complex algorithms when necessary.
- k-nearest neighbors (kNN)
k-Nearest Neighbors (kNN) is an instance-based learning algorithm for classification and regression. It classifies a sample based on the majority class among its k nearest neighbors.
kNN is non-parametric, making no explicit assumption about the data distribution. It is applied in areas like voter classification in elections and pattern recognition. While simple, its efficiency can diminish with high-dimensional data or large datasets.
As the data’s dimensionality increases, so does the distance calculation complexity. This significantly slows down the kNN algorithm in high-dimensional spaces.
kNN requires storing the entire training dataset for prediction. This can be memory-intensive for large datasets. Choosing the optimal value for k can be crucial for performance. Techniques to address these challenges exist, but they can add complexity to the model.
However, kNN’s simplicity and interpretability make it a valuable tool in many situations. Understanding basic relationships within a dataset or exploring more complex algorithms before committing to a specific model can be a good choice.
kNN can be effective for certain types of data, such as text data, where the underlying relationships may be more localized. Overall, kNN remains a relevant tool. This is especially true for smaller datasets and situations where interpretability is a priority.
- K-Means
K-Means clustering partitions data into k clusters. Each observation belongs to the cluster with the nearest mean. K-Means clustering minimizes within-cluster variance. This makes it popular for market segmentation, document clustering, and image compression. While efficient for large datasets, K-Means can converge to a local minimum rather than the global minimum. This necessitates multiple runs of the algorithm to achieve an optimal solution.
K-Means requires pre-specifying the number of clusters (k). This can be challenging, as the optimal number of clusters may not always be readily apparent.
K-Means is sensitive to the initial placement of centroids (cluster centers). Different starting positions can lead to different cluster configurations. The algorithm may also get stuck in local minima. Techniques like running the algorithm multiple times with different initializations can help mitigate this issue.
K-Means works best with numerical data and assumes spherical clusters. However, due to its simplicity, it remains a popular choice for many clustering tasks.
It provides a good starting point for data exploration and visualization. The resulting clusters can be used for further analysis or as features in more complex models. As machine learning continues to evolve, so too do techniques for addressing the limitations of K-Means.
- Random forests
Random Forest is an ensemble learning method that constructs multiple decision trees during training and merges them to improve prediction accuracy and control overfitting. Each tree votes and the majority decision is made. This robustness makes it suitable for various applications, including customer segmentation and anomaly detection. It handles categorical and numerical data and is less sensitive to overfitting than individual decision trees.
Beyond its core functionality, Random Forests offers several advantages. They excel at reducing overfitting, a common problem in machine learning. Random Forests combine the predictions of multiple decision trees. Each tree is trained on slightly different data and considers different features. This approach averages out potential biases in individual trees and leads to more generalizable models.
Random Forest’s ability to handle categorical and numerical data makes it a versatile tool for various tasks. This eliminates the need for separate algorithms depending on the data type. The voting mechanism provides a level of confidence in the predictions. Observing the distribution of votes across the trees allows us to assess the certainty of the overall model’s output.
However, Random Forest has limitations. One key drawback is interpretability. Unlike simpler models like decision trees, understanding the reasoning behind a Random Forest prediction can be challenging due to the combined influence of multiple trees.
Training a Random Forest can also be computationally expensive, especially for large datasets. Growing and combining numerous decision trees requires significant resources.
- Dimensionality reduction algorithms
Dimensionality reduction algorithms such as Principal Component Analysis (PCA) and t-Distributed Stochastic Neighbor Embedding (t-SNE) aim to transform data into a lower dimension. In doing so, they strive to preserve the essential features of the original data.
These techniques are vital for data visualization and speeding up subsequent machine-learning processes. They find use in fields like genomics and finance for simplifying models without losing critical information.
The core challenge lies in balancing information loss and dimensionality reduction. PCA, for example, focuses on capturing the maximum variance in the data. This can be very effective, but some subtle features may be discarded during the process.
t-SNE, on the other hand, prioritizes preserving the relationships between data points in the lower-dimensional space. This can be valuable for visualization, but it may not always perfectly capture the underlying structure of the data.
Choosing the right dimensionality reduction technique depends on the specific goals of the analysis. PCA might be a good choice if the priorities are interpretable and capture the most variance. If visualization and preserving local data point relationships are crucial, t-SNE could be more suitable.
- Gradient boosting algorithm
Gradient boosting builds models sequentially. Each new model corrects errors made by the previous ones. It is used for classification and regression, excelling in predictive modeling tasks due to its ability to handle various data types. Applications include fraud detection, risk management, and click-through rate prediction. Gradient boosting, known for its accuracy, can be computationally intensive.
The algorithm’s sequential nature, where each model builds on the errors of the previous one, can be computationally expensive, especially for large datasets. This can lead to increased training times and resource demands.
Some techniques mitigate this, such as limiting the number of boosting stages or sampling the data. However, these have their own considerations, potentially impacting the final model’s accuracy. Finding the right balance between computational efficiency and achieving optimal performance requires careful tuning of the algorithm’s hyperparameters.
Another aspect to consider is interpretability. Due to their sequential nature, Gradient boosting models can be more complex to understand than simpler algorithms. While the overall prediction can be accurate, it can be challenging to pinpoint the exact reasons behind each prediction.
Gradient boosting’s ability to handle diverse data types makes it a popular choice for many applications. As with other algorithms, ongoing research continues to address the challenges of interpretability and computational efficiency.
- AdaBoost algorithm
AdaBoost, short for Adaptive Boosting, combines multiple weak classifiers to create a strong classifier. It adjusts the weights of misclassified instances, focusing on hard-to-classify examples. This adaptability enhances performance on diverse datasets. It makes AdaBoost valuable in customer churn prediction and facial recognition applications. While sensitive to noisy data, its boosting process often yields high accuracy.
AdaBoost doesn’t treat all data points equally. It dynamically adjusts the weights assigned to data points based on their difficulty. AdaBoost ensures the learning process prioritizes the most challenging aspects of the data. They do this by focusing on the misclassified instances, leading to a more effective classifier.
While AdaBoost excels in many areas, it’s important to consider its susceptibility to noisy data. Outliers within the data can disrupt the learning process and lead to inaccurate predictions. Techniques like data cleaning become crucial steps when using AdaBoost to ensure the accuracy of its classifications.
Unveiling the potential of machine learning algorithms

This exploration of machine learning algorithms has highlighted their potential across various industries. Linear regression provides clear insights into the data, while SVMs excel at handling complex data.
Together, these algorithms offer a diverse toolkit for tackling intricate problems and undergoing a data transformation.
As we delve deeper into the ever-evolving field, these algorithms will continue to grow. They’ll encourage automation and intelligent decision-making. The potential for revolutionizing industries and enhancing our daily lives is vast.
However, navigating the balance between interpretability and complexity is crucial. Optimizing computational efficiency is also needed for widespread adoption.
Through ongoing research and development, we can unlock the true power of machine learning algorithms and shape a future brimming with groundbreaking advancements.


